
When Growth Outpaces the Product: Redesigning Enterprise Reporting for Scale
Introduction
A classic case of a company’s growth outpacing the product.
This case study highlights how I helped redesign and implement a new reporting solution within an Enterprise Manager for a cloud‑based POS suite in the Food & Beverages industry.
To comply with my non‑disclosure agreement, I have omitted and obfuscated confidential information. All information shared here is based on my direct experience and does not necessarily reflect the views of Infor Hospitality
The Product Suite
Infor POS product suite was a cloud‑based POS ecosystem designed for the Food & Beverages sector. It included:
Enterprise Manager (configuration & reporting)
POS terminals
Self‑service / kiosk terminals
Online ordering
Third‑party integrations
The suite supported both Quick Service Restaurants (QSR) and Full Service Restaurants (FSR), and was used across multiple sectors such as education, healthcare, aviation, and managed food services.
Originally, the solution was designed for small to medium‑sized operators (roughly 1–20 locations). At that stage, the Enterprise Manager focused on simple configuration flows and standardized drill‑down reports with limited customization.
My Role
I worked as a Technical Product Manager for the Enterprise Manager solution. I partnered closely with: UX leadership, Engineering teams and TPMs for adjacent products (POS terminals and self‑service terminals) on this initiative.
I also collaborated with cross‑functional stakeholders across Implementation, Customer Support, and Go‑To‑Market teams at different stages of the project. My role was to define the product direction, validate user needs, prioritize work, and ensure the solution scaled with the business.
The Process
The Challenge / Problem Statement
As the organization grew, the focus shifted toward much larger clients operating:
Multi-location restaurant groups
Food courts
Managed food services in hospitality, gaming, education, healthcare, aviation, and medical sectors
This shift introduced significant operational and technical complexity that the existing Enterprise Manager was not originally designed to handle. Complexity drivers included:
Deep and multi-level organizational hierarchies (enterprise → region → concept → location) which differ from operational hierarchies
Complex terminal and menu configurations varying by location, concept, or contract
Distinct data needs between operational users (day-to-day execution) and business users (financial and strategic decision-making)
Larger data volumes driven by higher transaction throughput and longer reporting periods
To support these customers, new features were incrementally layered onto the existing Enterprise Manager. However, these additions were often constrained by legacy design and data models. Over time, this resulted in:
Slower application performance as reporting queries scaled with data volume
Increased cognitive load due to deeply nested navigation and drill-down paths
Limited report customization, forcing users to run multiple reports or request manual exports
Higher dependency on support, implementation, and data teams to bridge reporting gaps
The cumulative effect was a platform that struggled to scale technically and experientially. It no longer delivered a fast, intuitive experience for smaller customers, while also falling short of the flexibility and performance required by large enterprises.
To address this, we made the decision to redesign the Enterprise Manager from the ground up.
High-Level Goals
Make the platform fast, easy, and flexible for all users
Ensure scalability for large enterprises
Deliver reporting that provides actionable business insights
Maintain backward compatibility
To tackle this, we split the problem into two parallel tracks - Configuration and Dynamic Reporting. This case study focuses on the reporting and analytics work.
Initial Research, Insights & User Empathy
Research Approach
Our research approach was grounded in user empathy, with the goal of understanding not just what users were doing in the system, but why certain workflows felt painful or inefficient.
Because this was an existing product with a diverse and mature user base, we deliberately combined multiple perspectives:
Voice of the customer through historical feature requests and support tickets helped surface recurring pain points and unmet needs.
Direct user empathy work through shadowing and interviews allowed us to observe real-world behavior, understand mental models, and identify moments of friction that users had learned to work around.
Behavioural analytics via Google Analytics helped validate whether insights from a small group of users scaled across the broader customer base.
From an empathy standpoint, shadowing sessions were particularly valuable. Watching users navigate the Enterprise Manager revealed gaps between how the system was designed to work and how users expected it to work. It highlighted frustration caused by long wait times, cognitive overload from deep drill-downs, and the mental effort required to recreate reports repeatedly.
This combination ensured that design decisions were informed by both emotional friction (frustration, uncertainty, loss of confidence) and measurable behavior at scale.
User Behavior Assessment
Because this was an existing product, we already had a strong signal of user pain points. Shadowing and interviews helped us understand why those issues existed across different personas. Analytics helped validate whether those patterns held true across the broader user base.
Using affinity mapping, several consistent themes emerged:
Users didn’t want to wait in front of a screen while reports generated
Customization was limited, often forcing multiple reports or manual exports
Drill‑down paths were hard to remember, especially for infrequently used reports
Reports needed to be delivered automatically
Reports needed to be easily shareable
These insights made it clear that reporting was the area with the highest friction and the biggest opportunity for impact. Based on this, we prioritized delivering the new reporting experience first—and made it accessible from the existing Enterprise Manager.
User Personas
Based on research, I defined three core personas for the dynamic reporting solution. These personas guided prioritization, permissions, and feature design.
.
Defining Success & Metrics
From the outset, it was important to define success in a way that balanced user experience improvements, business impact, and operational efficiency. Because this initiative involved redesigning an existing reporting platform, success metrics needed to be directly comparable to legacy behavior.
A key input into defining these metrics was a deep audit and categorization of the existing reporting landscape.
Report Categorization as a Foundation
I conducted a comprehensive review of the existing reporting solution, which included over 100 reports and their associated drill-downs. Each report was categorized into logical themes such as Sales, Operations, Accounting, Tips, and Tender etc.
For every report, I assessed:
Frequency of use across customer segments
Average time taken to generate the report
Relevance by user persona (financial, operational, frontline)
This exercise surfaced two important insights:
A small subset of report themes accounted for the majority of user value
Many high-value reports were buried behind deep and hard-to-remember drill-down paths
These insights directly influenced both prioritization and how success would be measured.
By tying success metrics directly to report categorization and usage patterns, we ensured that improvements were measured against real customer value rather than vanity metrics.
Workflow Improvement & Wireframing
The legacy reporting model relied heavily on deep drill‑downs, where clicking into linked columns opened additional reports. This made discovery and reuse difficult.
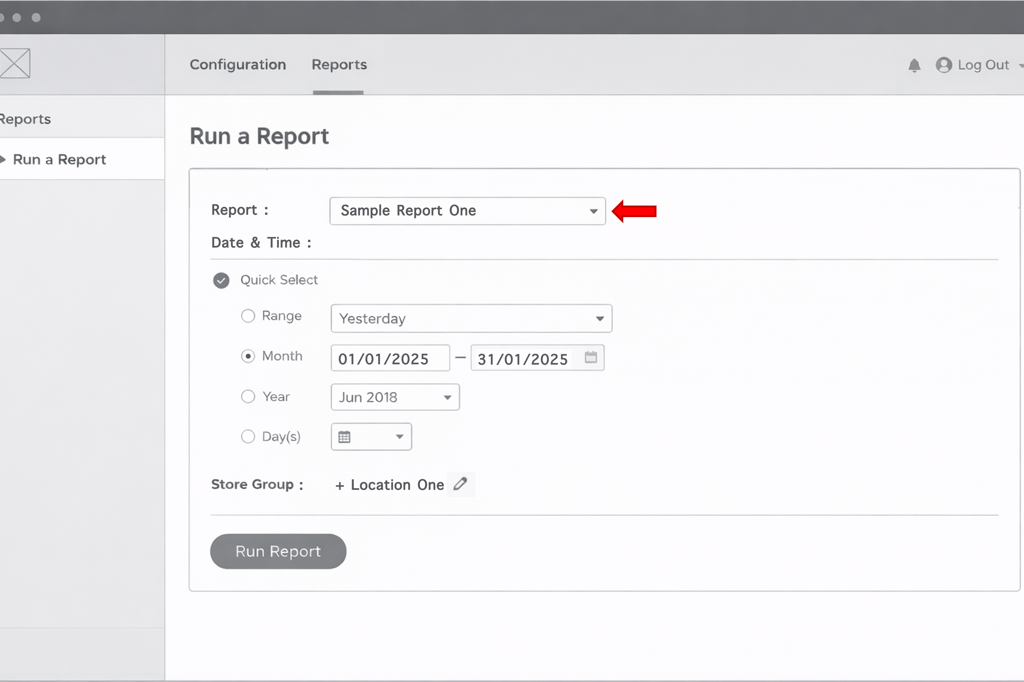
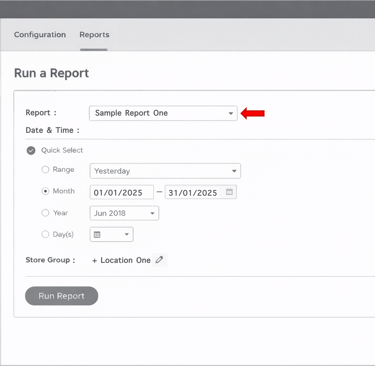
Figure 1.1 - Enterprise Manager Legacy Report Parameters
A/B Testing & Design Validation
Given that the dynamic reporting experience represented a significant shift from the legacy drill-down model, we intentionally validated the design through iterative A/B testing with real customers before finalizing the framework.
Working closely with the UX team, we created multiple design prototypes that explored different approaches to navigation, layout density, and report discoverability. These prototypes were tested with a mix of financial and operational users across enterprise customers.
The A/B testing focused on answering a few key questions:
Which layout helped users locate high-value reports with minimal effort?
Which navigation model made system-defined (legacy-equivalent) bookmarks easiest to find and understand?
How quickly could users recreate reports they previously relied on without guidance?
Which design reduced hesitation and trial-and-error when applying groupings, filters, and data points?
Sessions were conducted as moderated walkthroughs, where users were asked to complete realistic reporting tasks while verbalizing their thought process. This allowed us to observe not just task completion, but also moments of confusion, hesitation, and confidence.
Insights from these sessions directly influenced refinements to:
Navigation hierarchy and labeling
Placement and visibility of system bookmarks
Progressive disclosure of advanced options to avoid overwhelming users
Default states that aligned more closely with existing user mental models
Critically, A/B testing outcomes were explicitly tied to our success metrics. Design variants that reduced report discovery time, minimized backtracking, and increased successful first-time task completion were favored, as these behaviors proved to be strong leading indicators for higher feature adoption and repeat usage.
This validation approach reduced adoption risk at launch and directly contributed to the observed increase in feature adoption and reduction in feature transaction time—particularly among users transitioning from legacy reporting workflows.
Key Functional Concepts Introduced in Dynamic Reporting
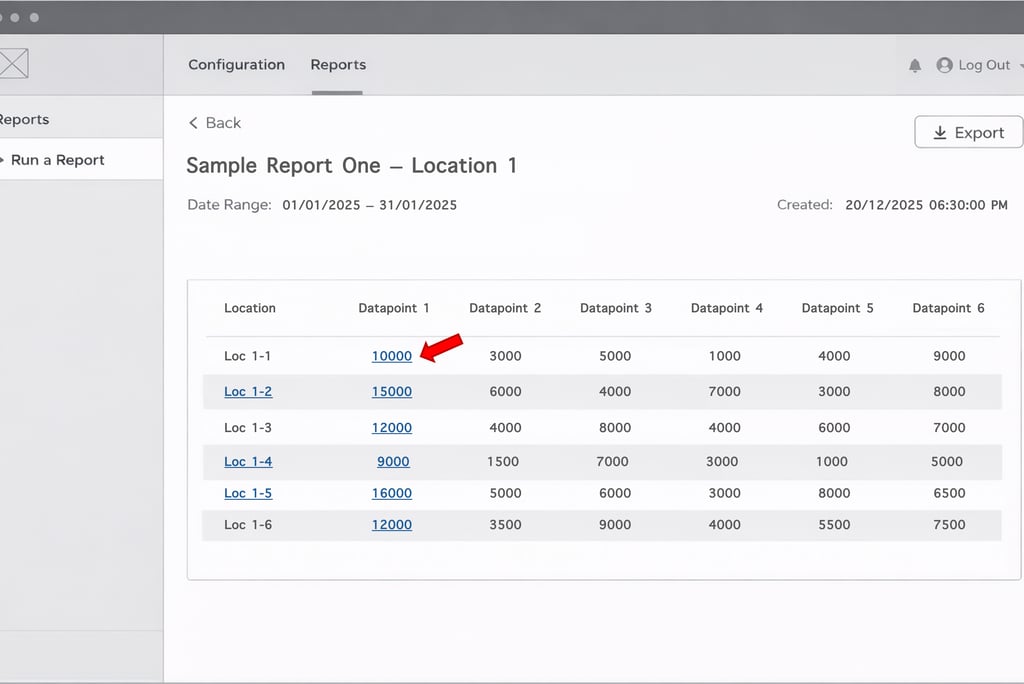
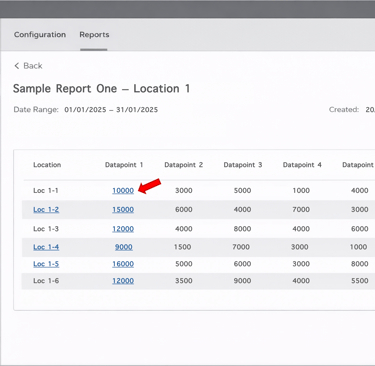
Figure 1.2 - Enterprise Manager Legacy Report Output (with drill drilldowns)
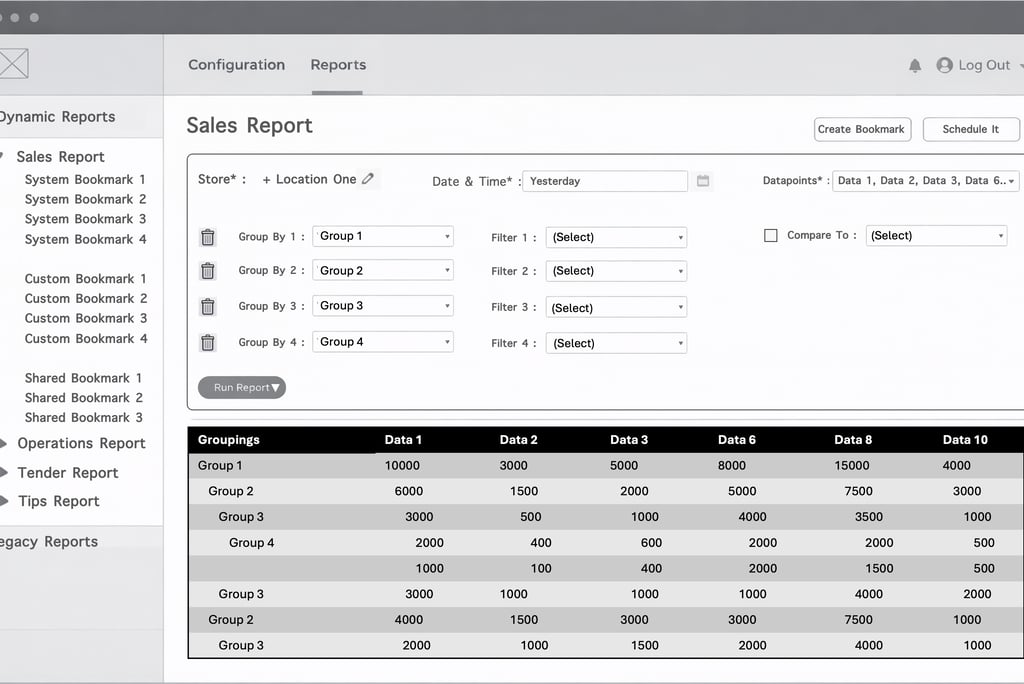

Figure 1.3 - Enterprise Manager Dynamic Report Interface
Additional Considerations
Rather than waiting for the full Enterprise Manager rebuild to be completed, we made a deliberate decision to surface dynamic reporting incrementally within the existing platform.
Granular Permissions: Introducing report-level permissions ensured users only saw data relevant to their role and access level. This improved trust in the system and reduced confusion for frontline users.
SSO Authentication: Leveraging SSO allowed us to seamlessly identify users, pass permissions, and maintain a consistent experience across platforms. This reduced friction for end users and simplified access management for IT and support teams.
Embedded Access in Existing EM: Providing access to dynamic reports inside the legacy Enterprise Manager minimized disruption, reduced retraining costs, and accelerated adoption.
Impact across stakeholders:
Users benefited from earlier access to improved reporting without waiting for a full platform migration.
Support and Implementation teams saw reduced dependency on manual exports and fewer report-related tickets.
Engineering and Data teams were able to validate scalability and performance improvements incrementally.
This approach ensured early value delivery while laying shared foundations required for the future Enterprise Manager.
Roadmapping
Using the RICE framework, I helped define a phased roadmap that balanced user value, technical dependencies, and delivery risk.
The Impact (Launch)
Launch Readiness
Before releasing the new dynamic reporting experience to customers, we invested time in ensuring the organization was fully prepared to support the change. Given the reach of Enterprise Manager across customers and internal teams, launch readiness was as critical as the feature itself.
Key launch-readiness activities included:
Internal enablement: I conducted demos and walkthroughs for implementation, customer success, and customer support teams to align everyone on the new reporting concepts, workflows, and terminology.
Training content: I created step-by-step training videos and supporting documentation that were made available within the platform, allowing customers to self-serve learning at their own pace.
In-product guidance: Contextual guidance was added for first-time users to help them understand key design elements, reduce initial friction, and build confidence quickly.
These efforts reduced support risk at launch, improved internal confidence, and ensured a consistent message across customer-facing teams.
Pilot Customer Release
We launched the Sales reporting theme first with a controlled group of pilot customers through the existing Enterprise Manager.
This phased rollout allowed us to:
Validate real-world usage patterns at enterprise scale
Observe how different personas adopted customization, scheduling, and subscriptions
Capture qualitative feedback alongside quantitative performance data
Insights from pilot customers were assessed and prioritized into the roadmap before expanding access to a wider audience over the following months.
Results
30% increase in feature adoption, driven by improved discoverability, bookmarks, and report subscriptions
65% reduction in feature transaction time, achieved through simplified workflows, scheduling, and backend optimizations
Beyond user-facing improvements, infrastructure changes delivered meaningful internal benefits:
Reduced redundant report execution due to subscriptions and shared outputs
Improved system stability under higher data volumes
A scalable foundation for future analytics and AI-driven capabilities
Together, these outcomes validated both the short-term user impact and the long-term platform strategy.
Future Direction
From the outset, the long-term direction of the Enterprise Manager was clear: evolve it from a reporting tool into an intelligent analytical platform that actively helps customers identify, understand, and act on business problems.
The dynamic reporting foundation was intentionally designed to support this direction by standardizing data models, improving performance, and enabling flexible data exploration. This created the prerequisites required to layer advanced analytics and AI-driven capabilities on top of reliable, well-structured data.
Strategic Focus Areas
Menu Optimization & Revenue Maximization
AI-driven analysis of historical sales, pricing, and product mix data can be used to surface insights such as underperforming items, cannibalization effects, and price sensitivity. Over time, machine learning models can help suggest optimal menu configurations and pricing strategies that balance volume, margin, and customer demand—while allowing operators to validate recommendations before acting.
Revenue Forecasting
Using historical trends, seasonality, and location-specific patterns, AI models can assist operators in forecasting revenue and understanding variance drivers. Rather than static projections, forecasts can continuously adjust as new data becomes available, helping operators plan staffing, inventory, and promotions more effectively.
Resource Optimization (Labor & Food)
By analyzing operational data such as labor hours, transaction throughput, and inventory usage, AI can help identify inefficiencies and opportunities for optimization. This can support better staffing decisions, reduce waste, and improve overall operational margins—particularly important for large, multi-location enterprises.
Operational Anomaly Detection
Pattern recognition models can be applied to operational data to flag anomalies such as unexpected voids, abnormal discount usage, or deviations in employee behavior. These insights help operators proactively identify potential fraud, training gaps, or process breakdowns before they escalate into revenue loss.
Natural Language Interfaces for Reporting
Building on structured reporting, natural language interfaces can allow users to interact with data conversationally—asking questions, generating reports, and receiving summarized insights without needing to understand report structures. AI-generated summaries and visualizations can help transform raw data into actionable recommendations, making insights accessible to a broader set of users.
Together, these capabilities represent a clear evolution from descriptive reporting toward predictive and prescriptive analytics—aligning the Enterprise Manager with the long-term needs of enterprise-scale food service operators.